Rabies Case Surveillance: New tracking component added to the Rabies Epidemiological Bulletin
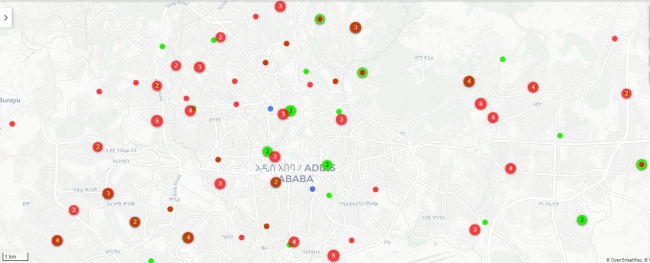
GARC recently augmented its Rabies Epidemiological Bulletin (REB)—a rabies-specific disease surveillance tool—by adding a new tracking component that allows laboratory case data to be geographically mapped immediately after it is entered on the REB system. This new database module, called Rabies Case Surveillance (RCS), easily and effectively correlates testing data with the location where the sample was collected, enabling strategic interventions and an improved understanding of a country’s rabies situation.
Testing samples for rabies is considered vitally important in the drive towards achieving “Zero by 30”. One reason for this is that diagnostic results allow for a better understanding of a country’s disease burden. Also, accurate laboratory diagnosis provides critical confirmation of the presence or absence of rabies in a specific animal or person. Ideally, this information needs to be correlated with the sample’s geographical location to determine at-risk areas for rabies, rabies hotspots, and rabies-free zones. Having this diagnostic information in-hand and linked to sample location drives targeted interventions—such as the preferential allocation of post-exposure prophylaxis (PEP) to clinics and targeted mass dog vaccination campaigns in rabies hotspots—as well as the determination of rabies-free areas.
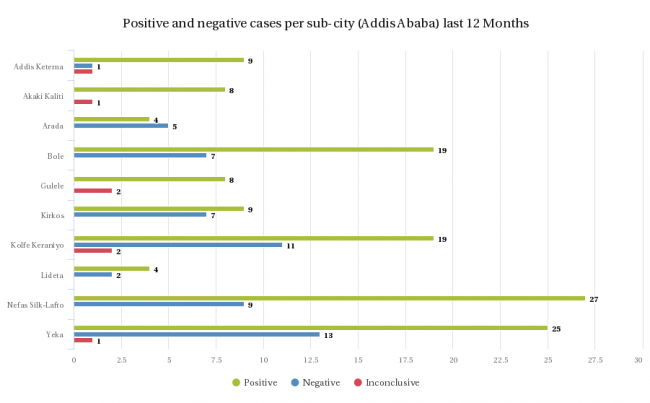
Many countries have already developed a system for laboratory diagnosis for rabies—either through national laboratories or collaborations with other stakeholders such as international or private organisations. However, the testing results are typically reported and stored on paper making it difficult to share or use the information efficiently. Uploading results formerly stored only on paper into the Rabies Case Surveillance (RCS) component is easy. Users can enter case information including species, date, coordinates, diagnostic outcome and the laboratory sample number. This information is automatically analysed by the REB with resultant outputs such as maps, graphs and tables that can easily be shared with other stakeholders. As such, the RCS not only provides accurate analyses, but also acts as a vital data repository for all laboratory cases diagnosed in the country.
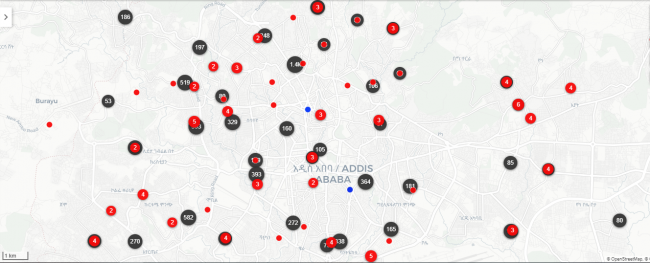
The RCS has been designed to provide high-resolution data, meaning that case data can be tracked down to the community level. Cases and results can be mapped down to a municipality, with the resultant graphs showing the case distributions by municipality over time. This enables users to identify specific administrative areas that have higher or lower numbers of cases and can facilitate intervention strategies to target those identified as high-risk.
The RCS outputs are also not limited to rabies case data alone, as this data can be overlaid with vaccination data (or any other data from the REB). This means that when tracking mass vaccination campaigns, the campaign managers will be able to identify areas where new cases have occurred and target these areas for future vaccination.
The RCS has been built to include contemporary and historical data. Therefore, trends can be observed over time and analysed to determine the distribution of rabies and potential movements and spread. The RCS has been beta-tested in Ethiopia where the government, in collaboration with the United States Centers for Disease Control and Prevention (US-CDC), has worked closely with GARC to enter contemporary data, as well as data from previous years, into the system.
Those interested in using the RCS component of the REB can contact GARC at: [email protected]. GARC can help create high-resolution surveillance data for individual countries and can also potentially assist in entering historical surveillance data into the system.
Contributed by Dr. Terence Scott, GARC Rabies Epidemiological Bulletin administrator. Additional information on the Rabies Epidemiological Bulletin can be found here.